Dynamic Material Characterization

Video: Deformation of Polycarbonate at a strain rate of 1000 /s.
The need for material charaterization at high strain rates
Testing of materials at elevated rates of strain is important due to viscoelastic effects: stiffness and strength can differ greatly at high loading speed compared to the quasistatic case. For example, plastic polymers used in automotive engineering can show a two-fold increase in strength when torn apart at strain rates typically encountered in crash scenarios (10 /s -- 100 /s). This increase in strength is often accompanied by some loss in ductility, i.e., polymers become stiff and brittle when torn apart rapidly as opposed to soft and ductile during quasi-static elongation.
Experimentally investigating this behavior is a challenging task, however: The presence of mass inertia resists rapid acceleration of the test specimen, and more importantly, the fixtures used to grip the specimen. At high testing velocities, rather than inquiring the forces required to deform a test specimen, we typically measure the inertial response of the testing apparatus. If no special testing equipment is used, this leads to force measurements which are completely dominated by oscillatory modes which prohbit any meaningful interpretation.
Split-Hopkinson Bar techniques
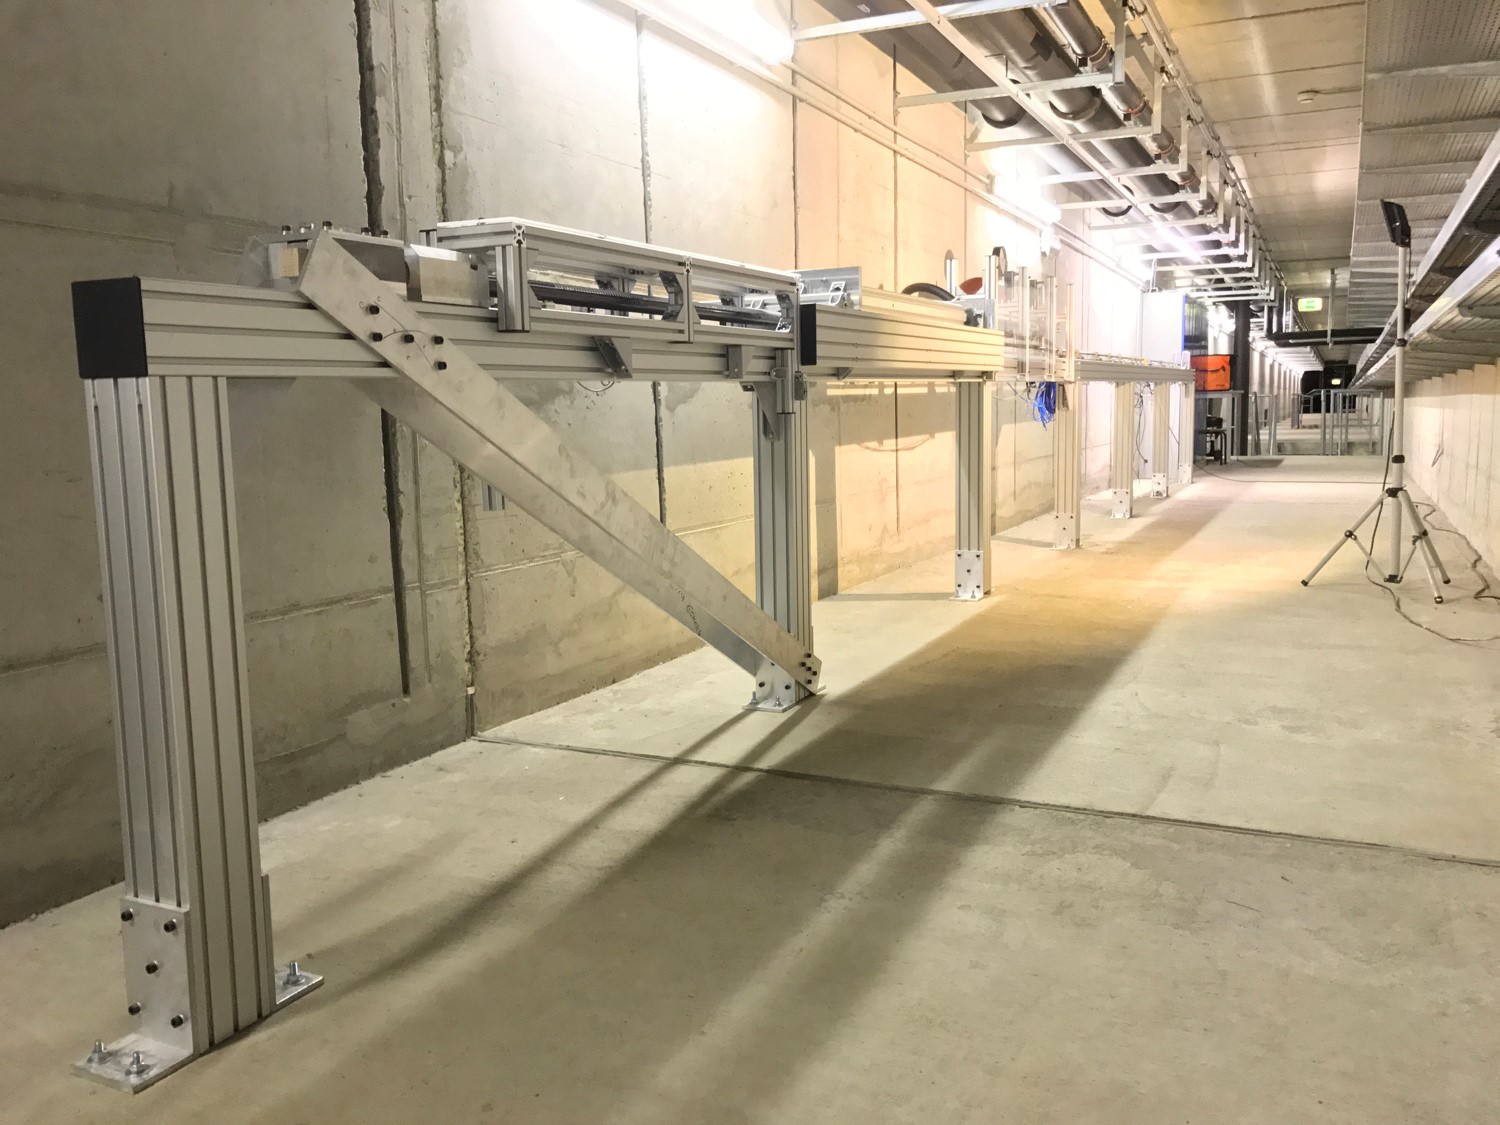
To circumvent these problems, we employ Split-Hopkinson Bar techniques. These methods are based directly on wave propagation mechanics, and require long and slender metal bars. Here is a photograph of our 12 m long tensile testing setup, suitable for strain rates between 200 /s to 5000 /s, depending on test speciment size..
General working principle
Compressed air accelerates a projectile, which subsequently impacts a transfer flange, connected to the input bar. Due to the impact, the transfer flang is displaced to the right, generating a left-travelling tensile wave which moves at the speed of sound through the material. A test specimen is mounted between the left end of the input bar and an output bar. The tensile wave travels through the test specimen into the output bar, where its amplitude is detected by means of a strain gauge. The strain gauge signal is proportional to the amount of force which acts on the test specimen. Due to differences in the acoustic impedance (product of mass density and speed of sound), a part of the tensile wave amplitude is reflected at the interfaces input bar -- specimen and specimen -- output bar. This causes the two interfaces, i.e., the left and right end of the sample, to move at different velocities, which causes elongation of the sample.
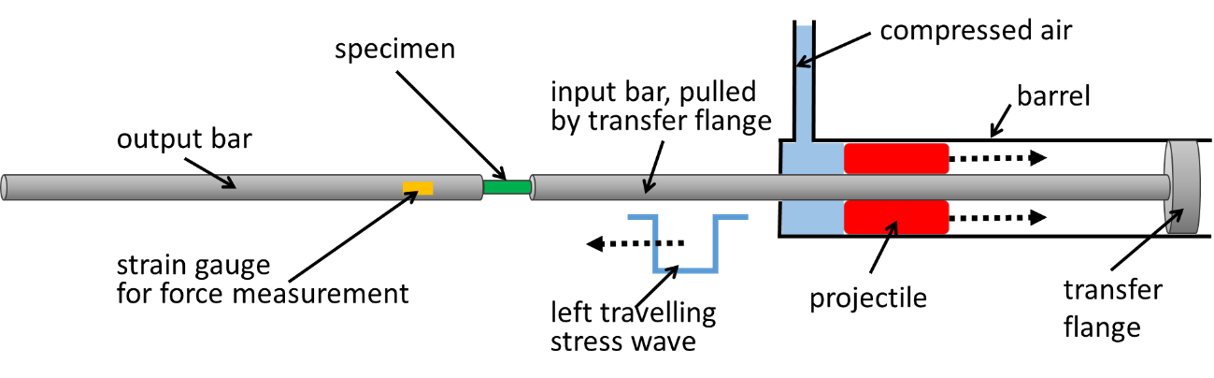 Figure above: schematic of the working principle of a Split-Hopkinson Bar.
Details of our setup and measuring equipment
Our setup is geared at measuring larges samples of low impedance, such as soft metals , polymers, or fiber-reinforced composites materials. Bars are made from aluminium and have 16 mm or 12 mm diameters, depending on test specimen size. The striker projectile is also made from aluminium and has a length of 3 m, resulting in pulse durations of 1.2 ms. Strain gages for determining the force acting on the specimen are sampled at 10 MHz using 16 bit A/D converters and a precision amplifier with a cutoff frequency of 1 MHz. While it is possible in principle to calculate specimen strain from a recording of the strains in input and output bar, we employ a direct optical measuring technique using a high-speed line scanning camera.
Examples of test and Results
Typical testing samples are pictured below.
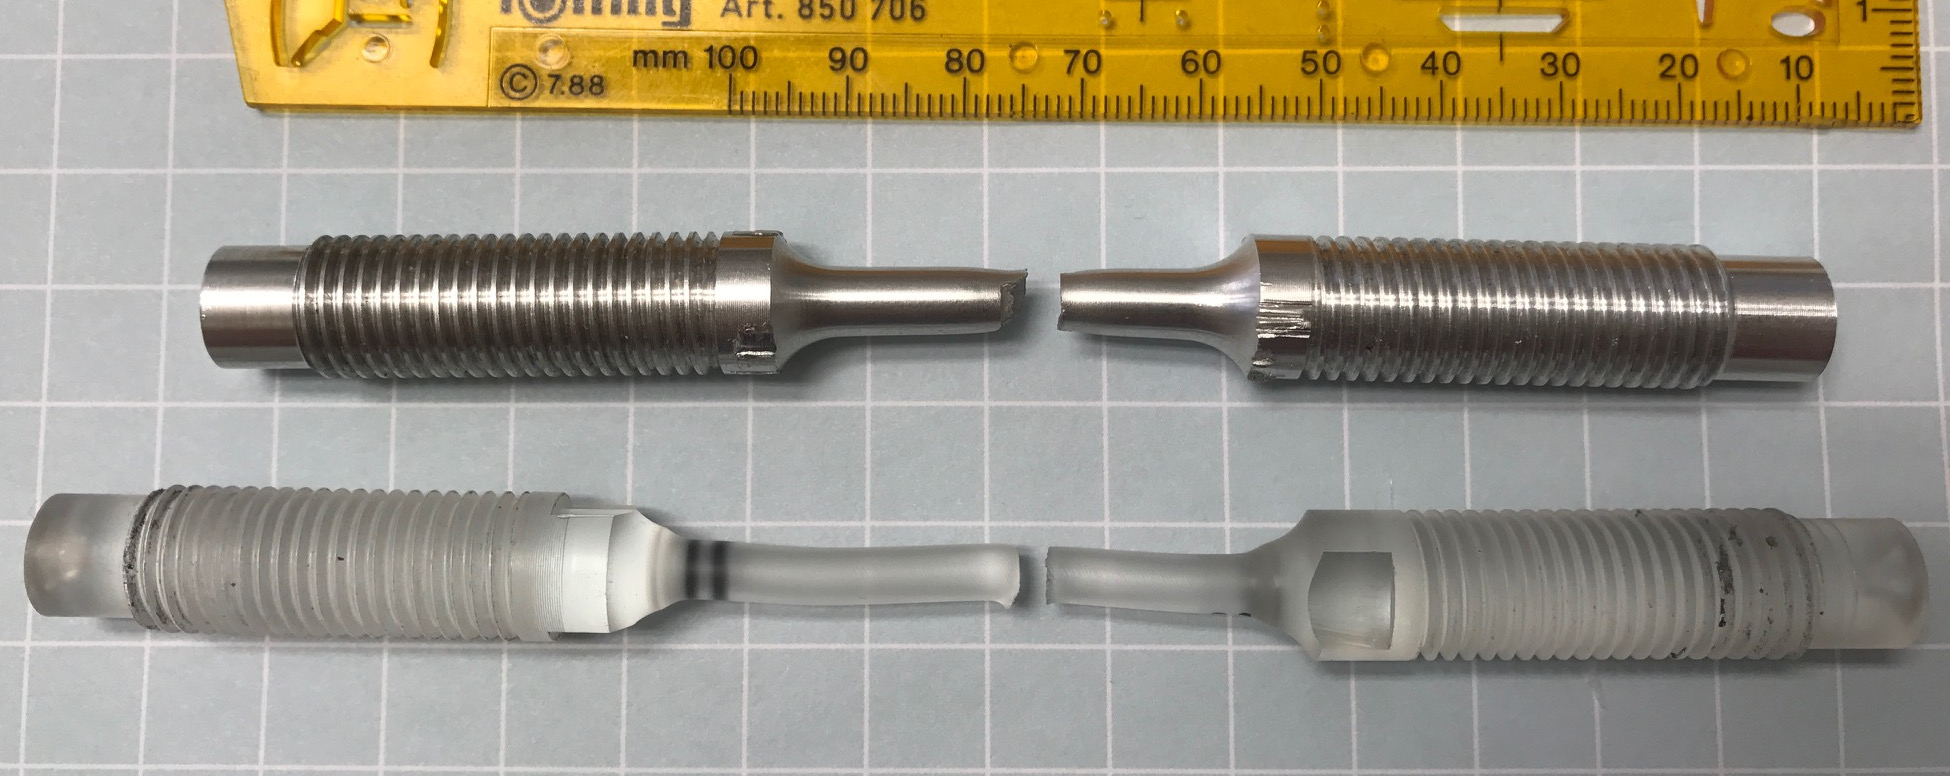

Figure above: Exemplary results from testing a sample of polycarbonate at nominal strain rate of 400 /s. The impact of the striker projectile generates a tensile wave in the input bar which induces a stress corresponding to a tensile load level of approx. 15 kN (red curve). This tensile acts upon the polycarbonate specimen, which yields at a force of approx. 3.5 kN (green curve). The sample is elongated by approx. 10 mm during the test, corresponding to a strain of 42%.